Actinolite — NIR2,126 points · 4000–12500 cm⁻¹
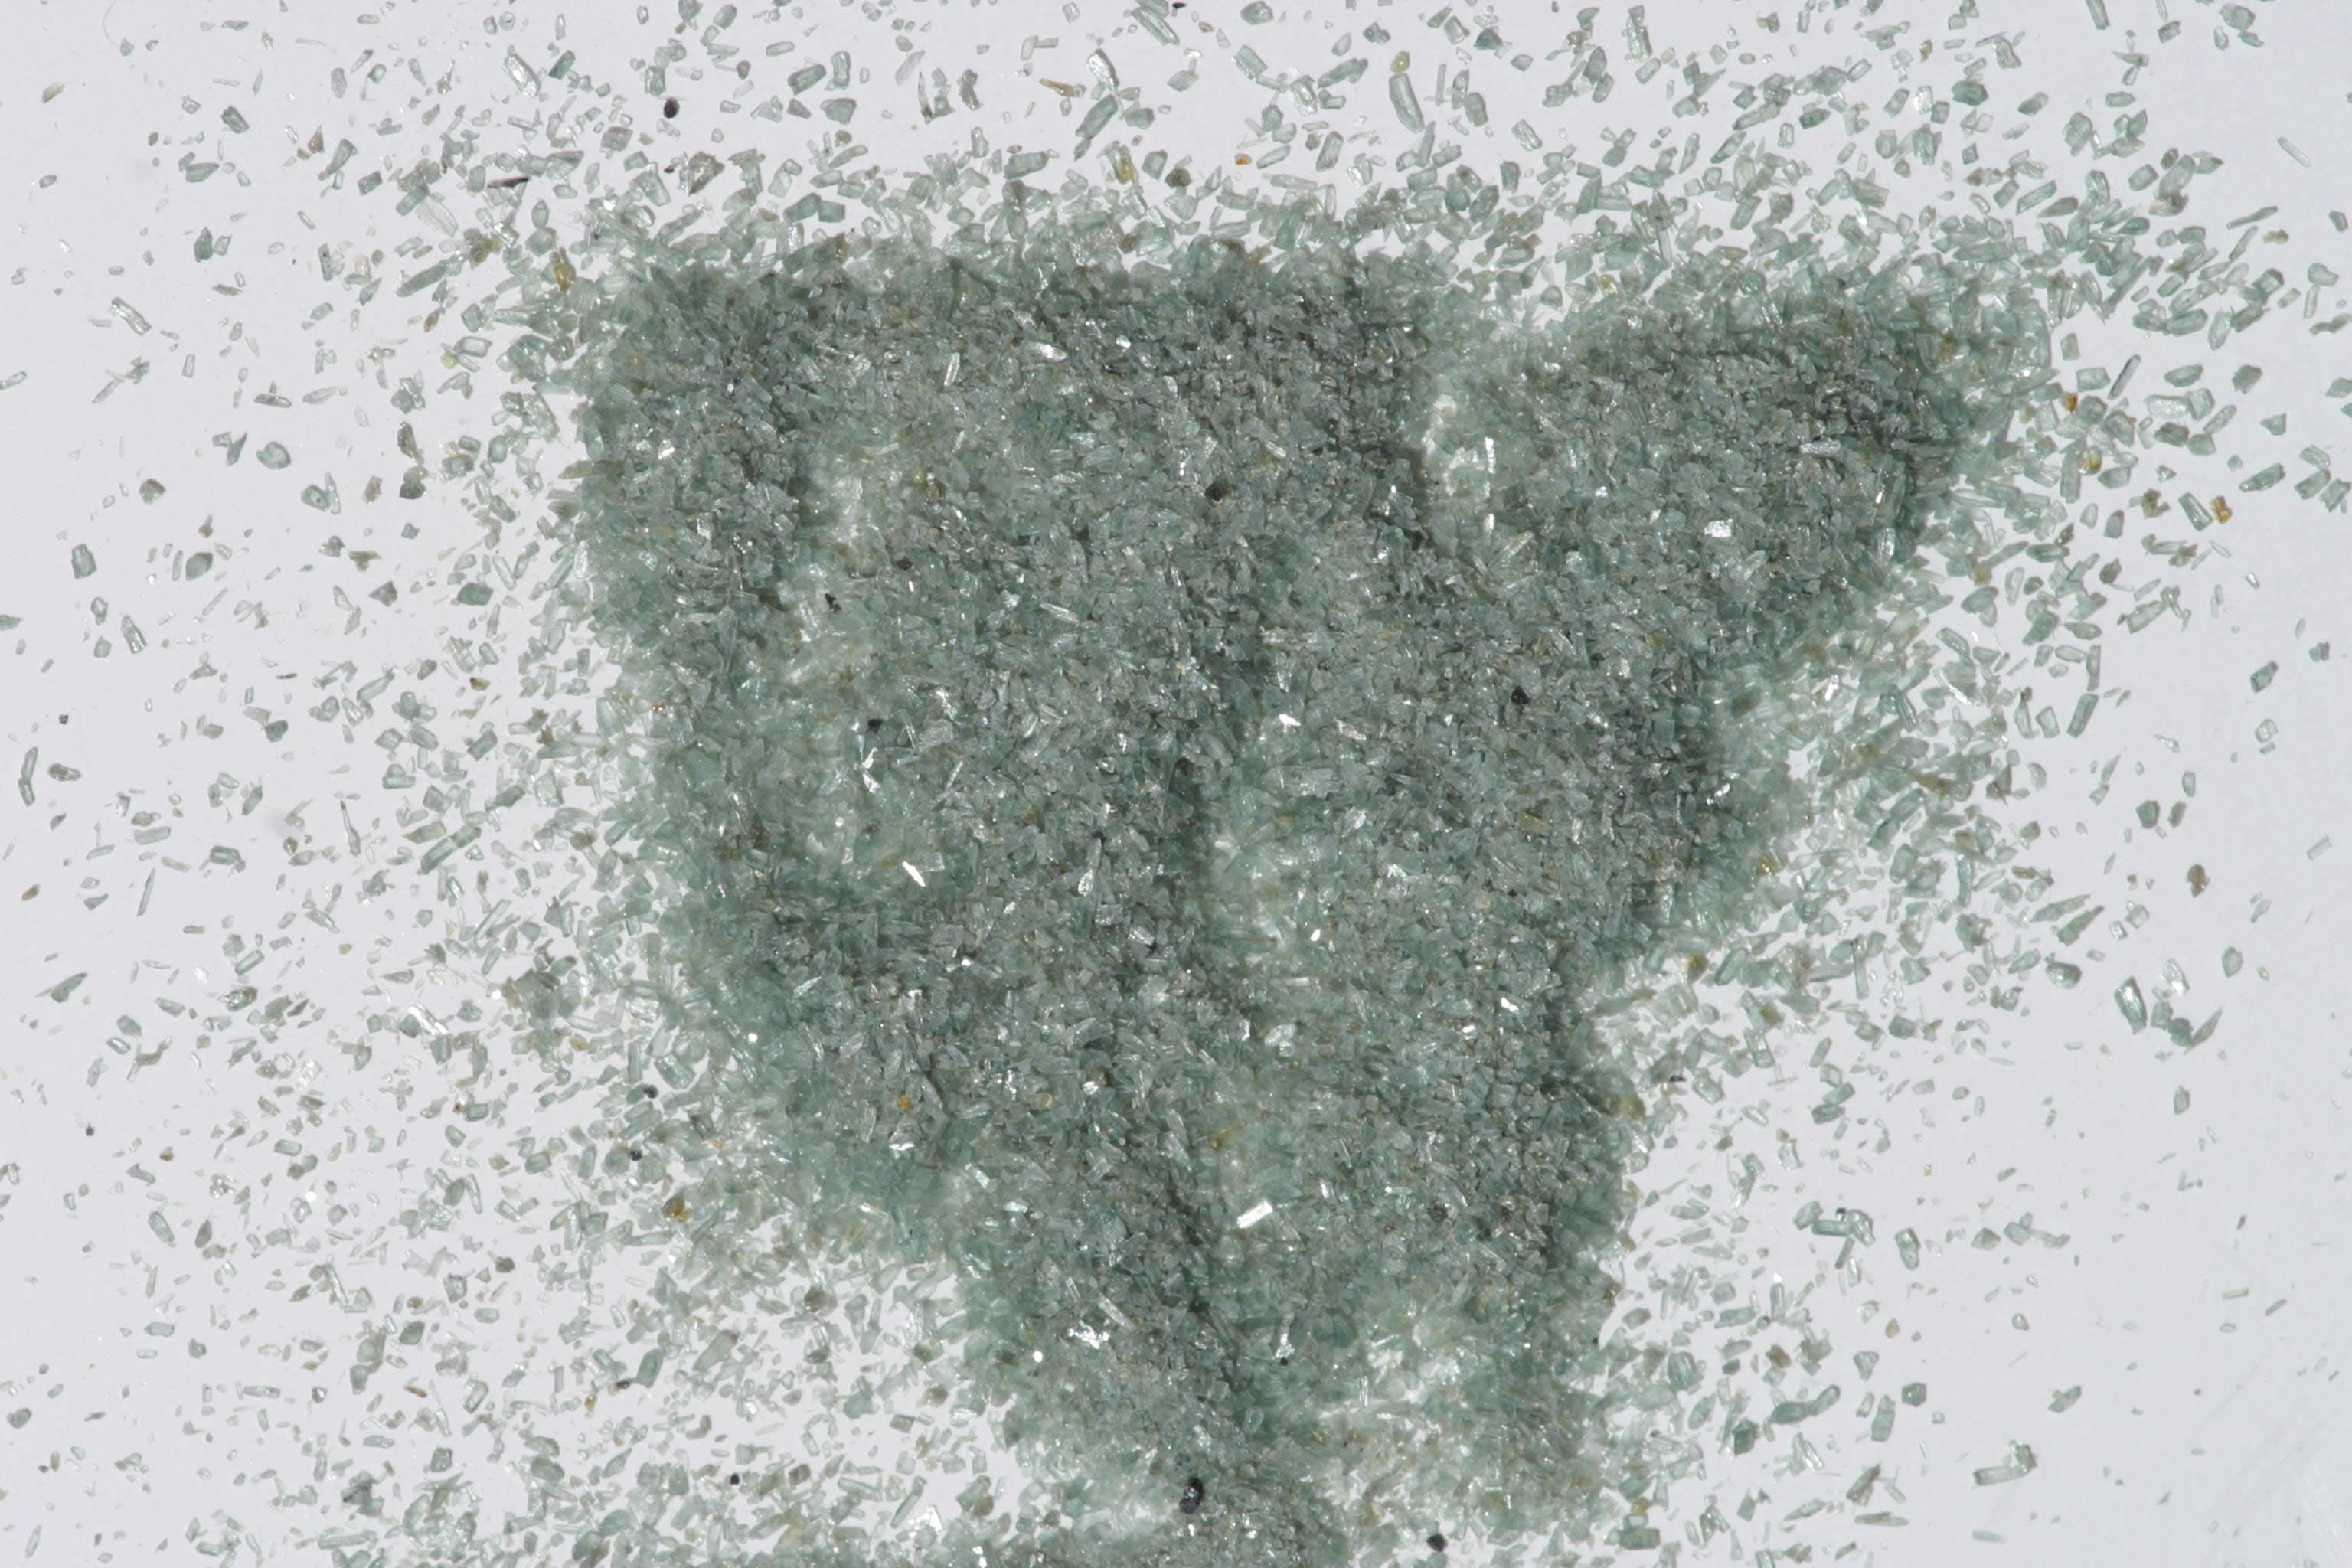
Sample photograph — USGS Spectral Library v7
Spectrum Details
- Modality
- NIR
- Category
- mineral
- Material Type
- Inosilicate
- Sample ID
- HS116.1B, HS116.2B, HS116.3B, HS116.4B
- Collection Locality
- San Bernadino, CA
- Spectral Purity
- 1b2_3_4_ # HS116.1B # 1= 0.2-3, 2= 1.5-6, 3= 6-25, 4= 20-150 microns SPECTRAL_PURITY: 1b2_3_4_ # HS116.2B # 1= 0.2-3, 2= 1.5-6, 3= 6-25, 4= 20-150 microns SPECTRAL_PURITY: 1b2_3_4_ # HS116.3B # 1= 0.2-3, 2= 1.5-6, 3= 6-25, 4= 20-150 microns SPECTRAL_PURITY: 1b2_3_4_ # HS116.4B # 1= 0.2-3, 2= 1.5-6, 3= 6-25, 4= 20-150 microns
- Composition / XRD
- EPMA # XRF, EPMA, ICP(Trace), WChem COMPOSITION KEYWORD Oxide ASCII Amount Weight Percent, % Oxide html COMPOSITION: SiO2 57.78 wt% SiO2 COMPOSITION: TiO2 0.02 wt% TiO2 COMPOSITION: Al2O3 0.22 wt% Al2O3 COMPOSITION: Cr2O3 0.06 wt% Cr2O3 COMPOSITION: FeO 4.38 wt% FeO COMPOSITION: MnO 0.12 wt% MnO COMPOSITION: MgO 22.39 wt% MgO COMPOSITION: CaO 12.13 wt% CaO COMPOSITION: Na2O 0.38 wt% Na2O COMPOSITION: K2O 0.07 wt% K2O COMPOSITION: Total 97.55 wt% COMPOSITION: O=Cl,F,S wt% #correction for Cl, F, S COMPOSITION: New Total wt%
- Sample Description
- Forms a series with Tremolite and Ferro-actinolite. Original spectrum published in: Hunt, G.R., J.W. Salisbury, 1970, Visible and near-infrared spectra of minerals and rocks: I. Silicate minerals. Modern Geology, vol. 1, pp283-300. With the note that this sample lacks the contamination by opaque inclusions that is seen in the actinolite sample HS22. A spectrum of this sample is also published in: Clark, R.N., T.V.V. King, M. Klejwa, G. Swayze, and N. Vergo, 1990, High spectral resolution reflectance spectroscopy of minerals: J. Geophys Res., v. 95, 12653-12680. Where it is noted that, although XRD indicates chlorite but no chlorite bands are seen spectrally, microscope analysis indicated ~1% opaque and ~5 volume% chlorite as contaminants. Grain size fractions are indicated by the extension after the sample number: .1B = Analysis of cation proportions indicates that this actinolite is low enough in iron to border on being called a tremolite. IMAGE_OF_SAMPLE:
- XRD Analysis
- Analysis by Norma Vergo indicates Actinolite + Chlorite
- X Units
- cm⁻¹
- Y Units
- Absorbance
- Data Points
- 2,126
Download
Attribution
USGS Spectral Library Version 7, U.S. Geological Survey
License: Public Domain
DOI: 10.3133/ds1035Analyze in Workbench
Open this spectrum in the SpectralBench workbench for advanced analysis, peak detection, and comparison.
Open Workbench