Grass
Grass — NIR2,126 points · 4000–12500 cm⁻¹
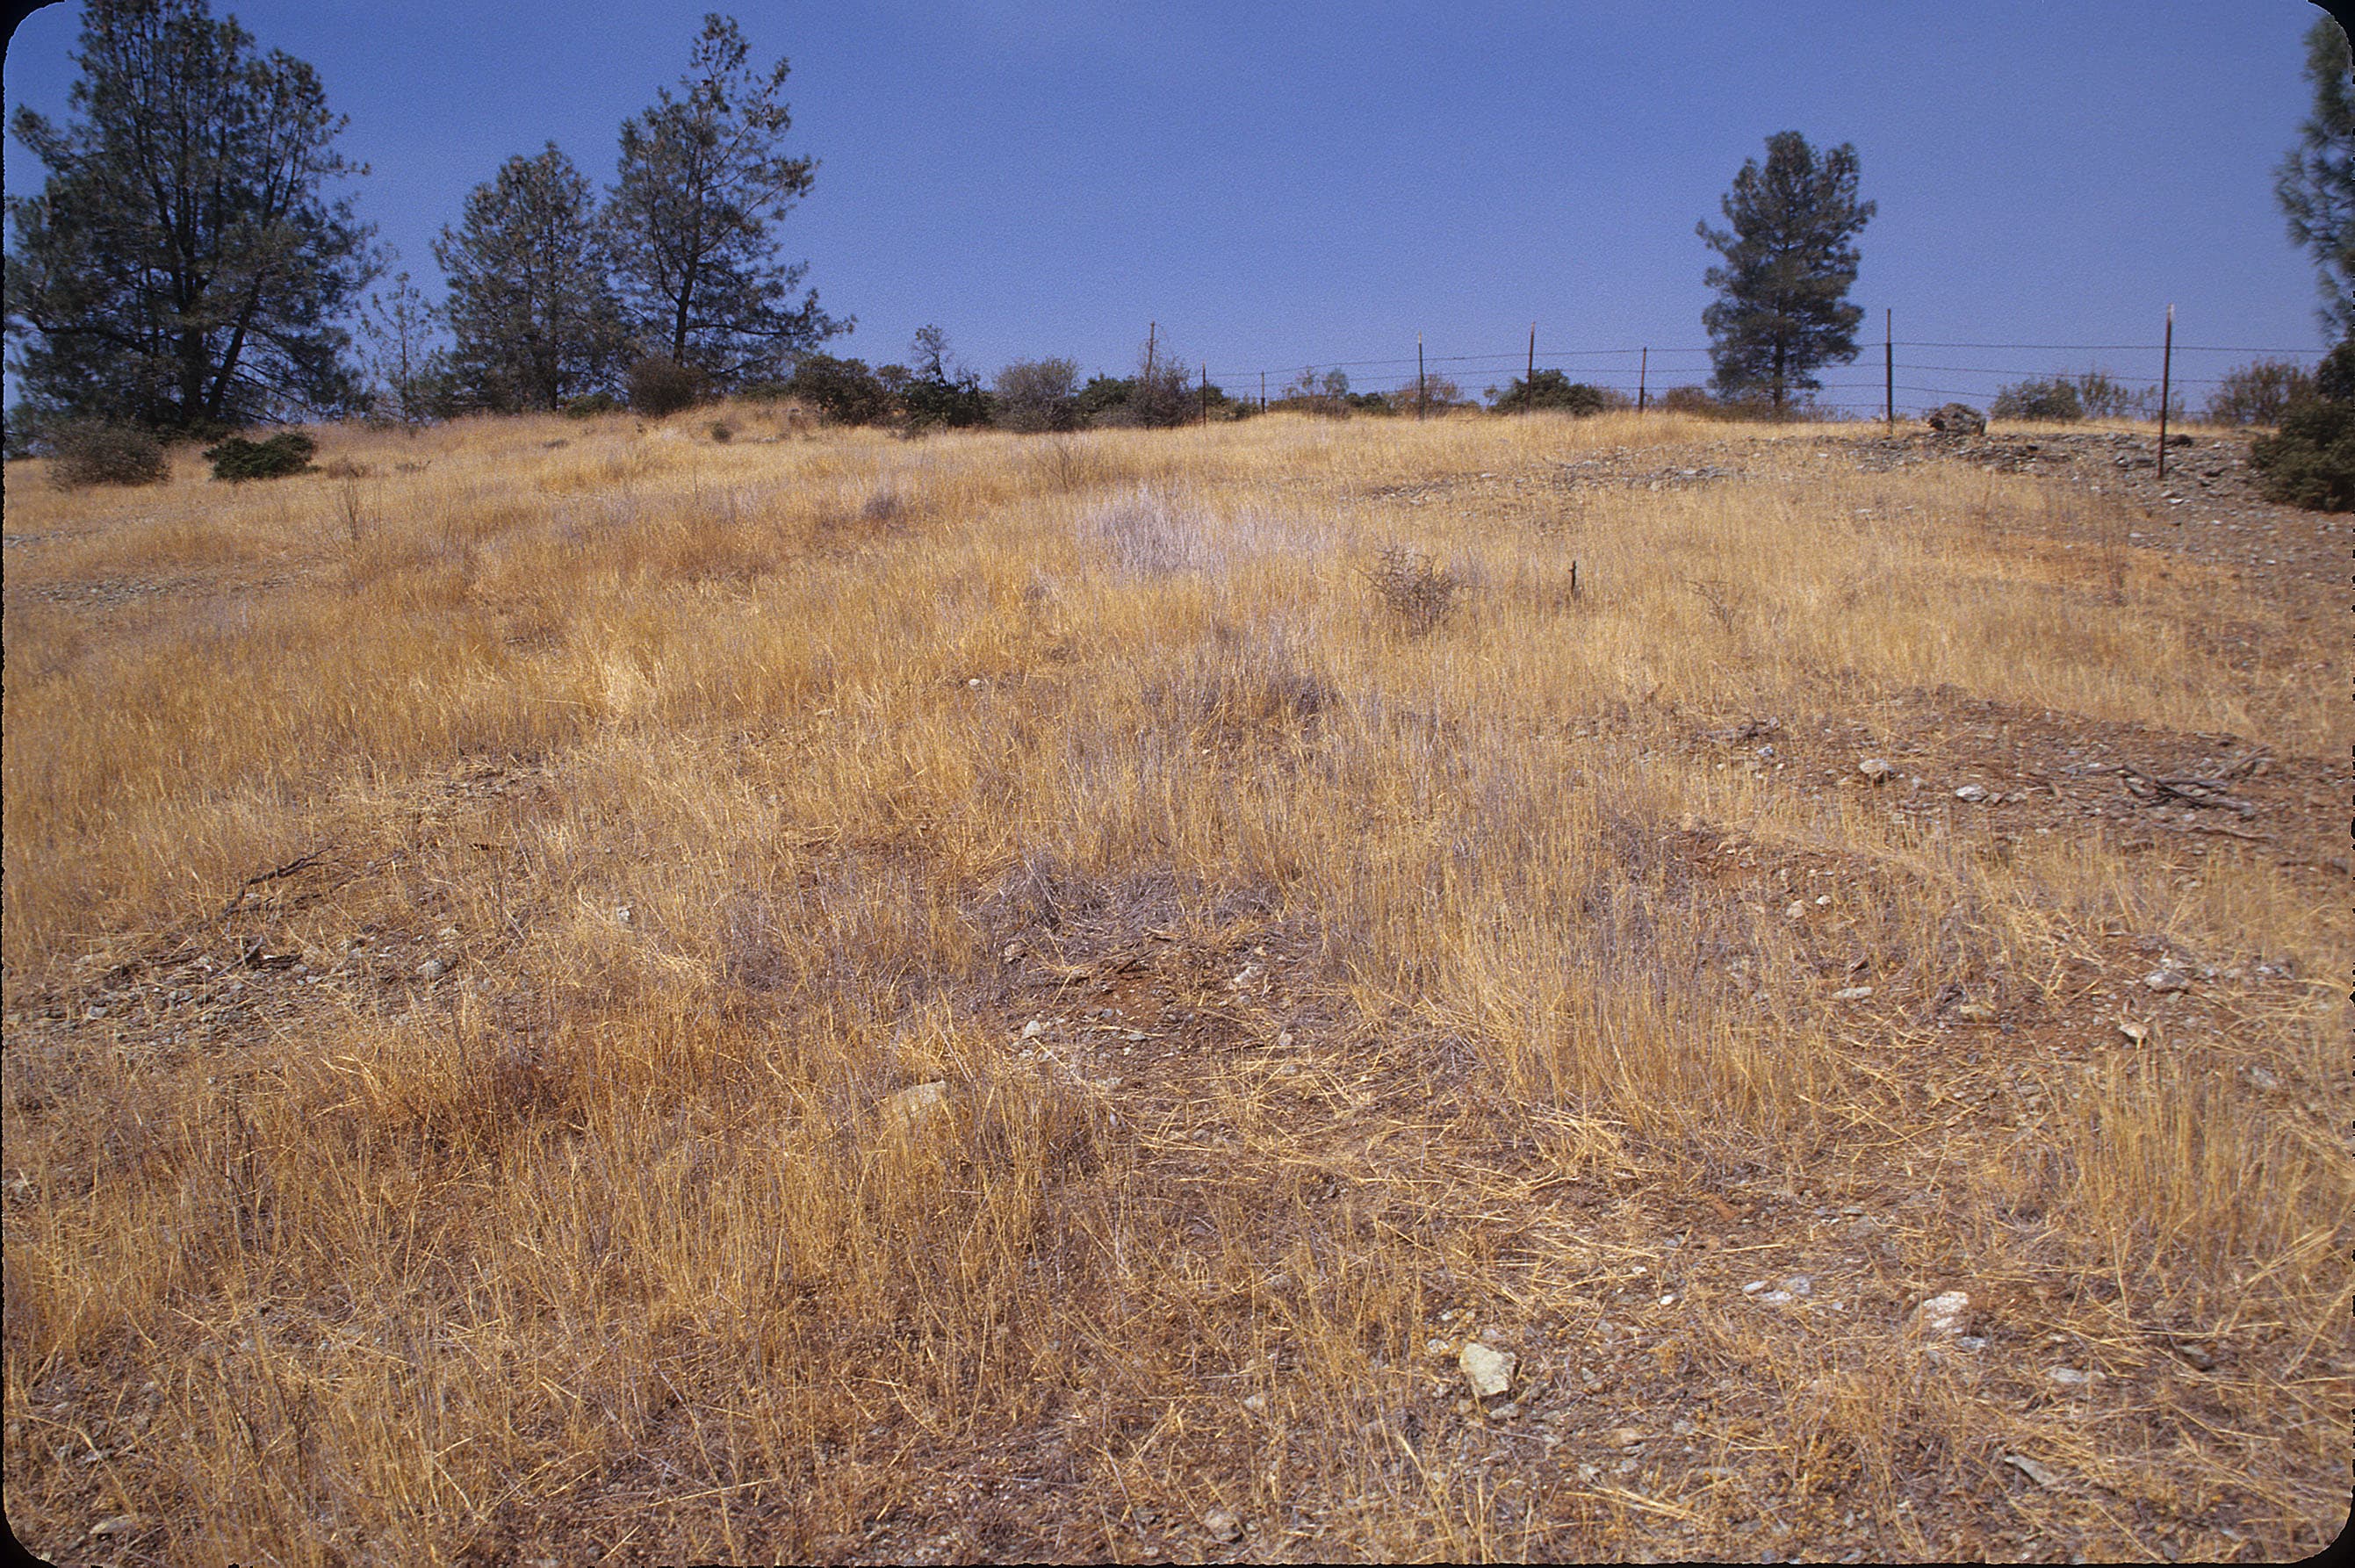
Sample photograph — USGS Spectral Library v7
Spectrum Details
- Modality
- NIR
- Category
- vegetation
- Material Type
- PLANT
- Sample ID
- CA01-AETR-2
- Collection Locality
- Garden Valley area, in El Dorado county, approximately 60 km northeast of Sacramento, California
- Spectral Purity
- 1a2_3_4_ # 1= 0.2-3, 2= 1.5-6, 3= 6-25, 4= 20-150 microns
- Sample Description
- This spectrum is the average reflectance of 12 field measurements of an area of barbed goatgrass (Aegilops triuncialis) with exposed serpentine rock. The measurements were made at 11:00 am local time on September 6, 2001. These spectra were made using an ASD FullRange spectrometer (model 653) in reflectance mode, relative to a Spectralon reference panel. The bare fiber of the spectrometer was used to measure the reflectance spectra of the grass. The grass was a light brown color and in a dry, non-photosynthetic vegetative (NPV) state. Gray and brown litter dominated the space between the remnant grass stems. The standing dead grass and litter had a combined cover of 70%. The remaining 30% surface cover was exposed rock (a green colored serpentine) and soil (red in color). The fiber optic cable was pointed at nadir and held at waist height while walking around the grass area during the measurement. The instrument was programmed to record 6 second averages of reflectance (thus, each recorded spectrum was an average of 60 individual measurements). An average spectrum was computed from the recorded measurements and converted to absolute reflectance by multiplying by the reflectance spectrum of the Spectralon reference panel. Other spectra, of a grass area and of buckbrush, were also measured in this area and are included in this spectral library, sample names: CA01-AETR-1, CA01-CECU-1, CA01-CECU-2 and CA01-CECU-3. This spectrum was used in the following publication: Swayze, G.A., Kokaly, R.F., Higgins, C.T., Clinkenbeard, J.P., Clark, R.N., Lowers, H.A, Sutley, and S.J., 2009, Mapping potentially asbestos-bearing rocks using imaging spectroscopy, Geology Volume 37, pages 763-766. http://dx.doi.org/10.1130/G30114A.1 IMAGE_OF_SAMPLE:
- X Units
- cm⁻¹
- Y Units
- Absorbance
- Data Points
- 2,126
Download
Attribution
USGS Spectral Library Version 7, U.S. Geological Survey
License: Public Domain
DOI: 10.3133/ds1035Analyze in Workbench
Open this spectrum in the SpectralBench workbench for advanced analysis, peak detection, and comparison.
Open Workbench